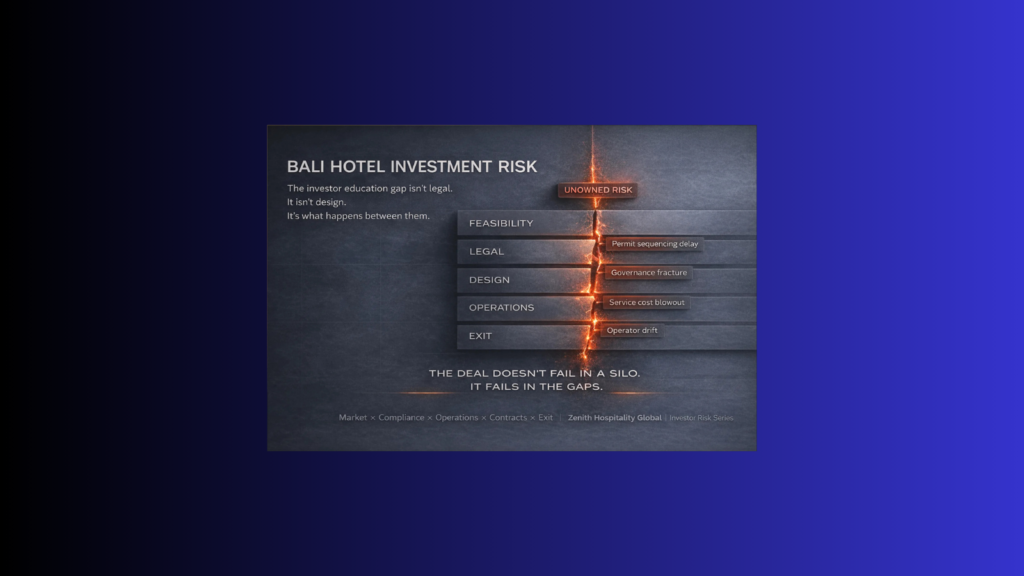
In Bali, most hotel financial models obsess over ADR, occupancy, and “market upside.” But hotel operating costs Bali is where returns quietly die.
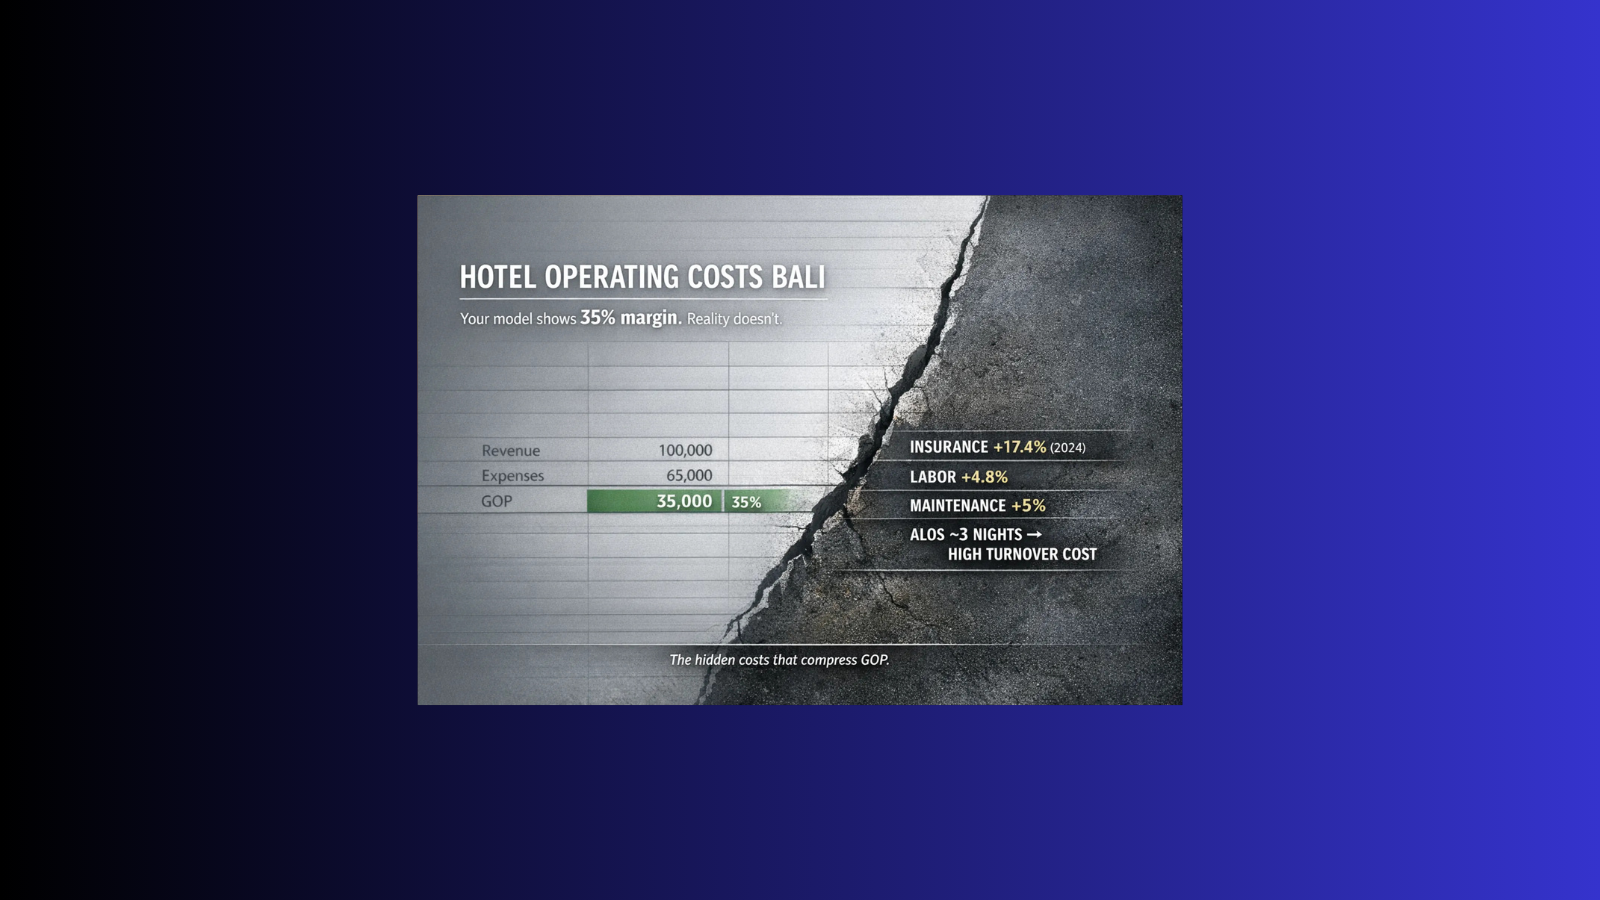
Your model assumes a 35% operating margin. Then reality hits: insurance re-prices, payroll creeps up, and maintenance becomes a permanent tax. CBRE’s 2025 operating-cost review shows how below-the-line pressures—especially insurance—can move sharply year-on-year. And Bali’s tropical environment makes under-budgeting maintenance a predictable failure mode, not bad luck.
If you are underwriting a deal, hotel operating costs Bali must be modeled as a system, not a ratio.
TL;DR — Key takeaways (for investors and owners)
- Margins in Bali are protected in cost architecture, not “won” in topline.
- Insurance is no longer a rounding error—it can jump fast and hit cash flow immediately (CBRE).
- Short stays increase turnover cost intensity (housekeeping, laundry, amenities, FO transactions) per occupied room month.
- Tropical maintenance is not optional—humidity and salt exposure raise lifecycle replacement needs.
- Utilities can spike via classification/tariff mechanics, not only consumption.
- When demand softens, cost inflation becomes a margin trap—because the cost base does not fall at the same rate.
Who this is for
This guide is built for foreign investors, developers, asset managers, and hotel owners underwriting (or re-underwriting) Bali performance—and who want a reality-based view of hotel operating costs Bali before margins compress.
If you want the wider investment-risk lens (supply pressure, rate wars, and ROI defensibility), read: Bali’s real-estate bubble: oversupply threatens ROI.
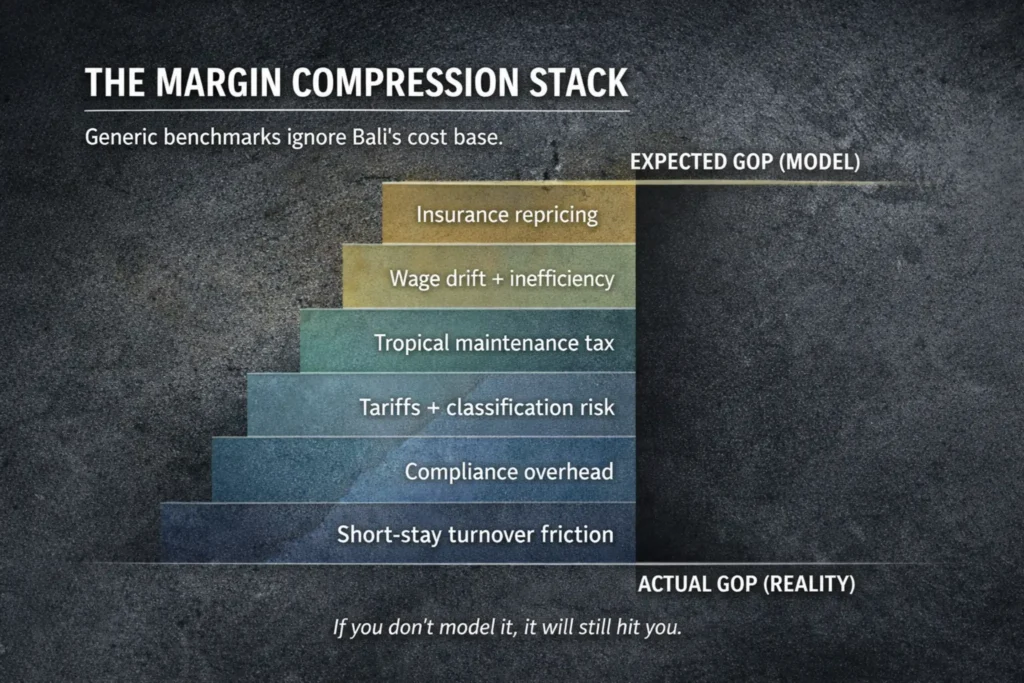
Why generic benchmarks fail for hotel operating costs in Bali
Most feasibility studies apply global averages: payroll at X%, maintenance at Y%, insurance at Z%. The result looks clean and bankable—but it ignores local drivers that permanently shift the cost base:
- Climate intensity (humidity + salt + monsoon exposure) increases maintenance cadence and lifecycle replacement.
- Risk pricing (earthquake/volcano/flood exposure + reinsurance cycles) lifts premiums and deductibles.
- High turnover economics (short stays) push labour, laundry, amenities, and linen loss higher per room night.
- Utilities volatility driven by tariff structures and classification.
- Compliance overhead that grows with scale and complexity.
If your underwriting does not explicitly model these factors, your “35% margin” is not a projection. It is a hope.
Hotel operating costs Bali: what actually hits your P&L
1) Insurance: the silent balance-sheet tax
Insurance is frequently understated because many models treat it as a static line item. But it is directional and volatile. CBRE’s operating-cost commentary for 2024/2025 highlights insurance as one of the most problematic lines for owners—often moving faster than revenue growth expectations.
External reference: CBRE — All Eyes on Operating Costs in 2025 (Lessons Learned in 2024).
What typically makes Bali worse than a generic market
- Natural-hazard exposure (earthquake/volcano/ash/flood) influences underwriting assumptions and exclusions.
- Higher replacement cost (imported systems, specialist contractors).
- Deductible drift and tighter terms on renewal.
Investor implication: insurance is not only “more expensive”; it can become more restrictive, increasing your uninsured risk and the need for reserves.
2) Labour: inflation + compliance + “turnover friction” from short stays
Labour is usually the largest controllable cost line—yet it is often modeled lazily. Even modest wage inflation becomes dangerous when productivity assumptions are wrong.
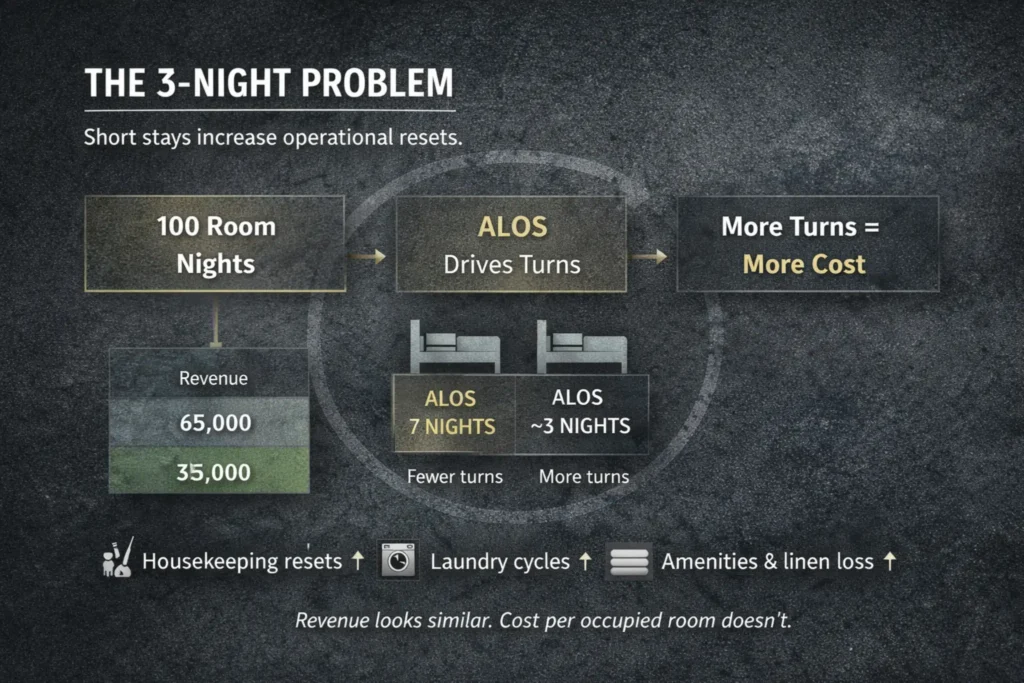
A. Short stays create a labour-inefficiency penalty
Bali’s tourism stats show short average lengths of stay at classified hotels; that increases arrivals/departures per occupied room month, which increases: housekeeping resets, linen cycles, guest messaging volume, and service recovery incidents.
External reference: BPS Bali — Tourism Development (Nov 2024).
B. Compliance complexity is a real cost, not a footnote
HR compliance, documentation, payroll structure discipline, and training cadence create real overhead—especially for owners trying to operate “lean” without operator-grade systems.
Investor implication: when the staffing model is wrong, it becomes a permanent margin drag.
If you want a practical reference on operational “leak fixing,” see: Hotel F&B profitability: why your restaurant is bleeding cash (and how to fix it).
3) Maintenance: Bali’s climate turns “optional” into “mandatory”
Maintenance is where Bali punishes generic models hardest. The issue is not only annual increases—it is the baseline and the frequency demanded by climate.
Bali’s operating environment often includes:
- Humidity-driven mold and material fatigue
- Salt-air corrosion (coastal and near-coastal assets)
- Monsoon cycles exposing roofing/drainage/waterproofing weakness
- Filtration and mechanical stress during dust/ash events
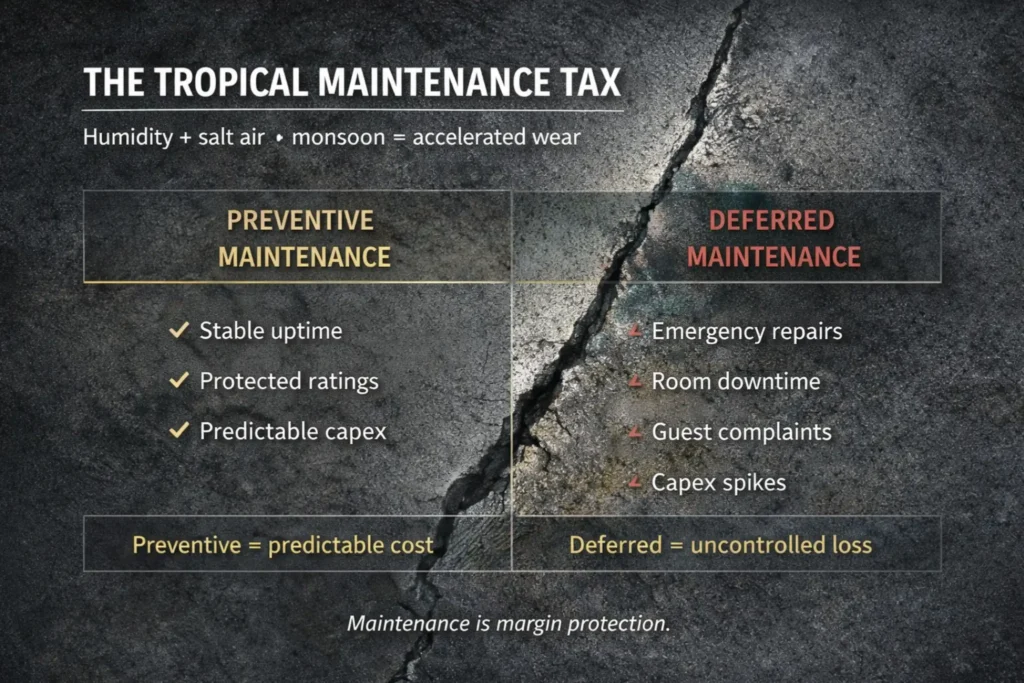
Investor implication: underfunded maintenance does not “save money.” It converts into:
- guest experience failures (ratings drop)
- emergency repairs (higher cost per incident)
- shortened asset lifecycle (capex spikes)
- revenue loss through room downtime
For a compliance-driven view of “hidden cost exposure” (fines, shutdown risk, structural risk), see: Hidden cost of illegal villas in Bali — crackdowns & fines.
4) Utilities and classification shocks: the “villa tariff” problem
Utilities costs in Bali are not only about consumption—they are also about tariff structure and classification.
In practice, some properties get pushed into non-domestic / industrial-style tariffs based on how they are classified, which can materially change the bill profile.
External reference: Water bills and charges in Bali — tariff and classification discussion.
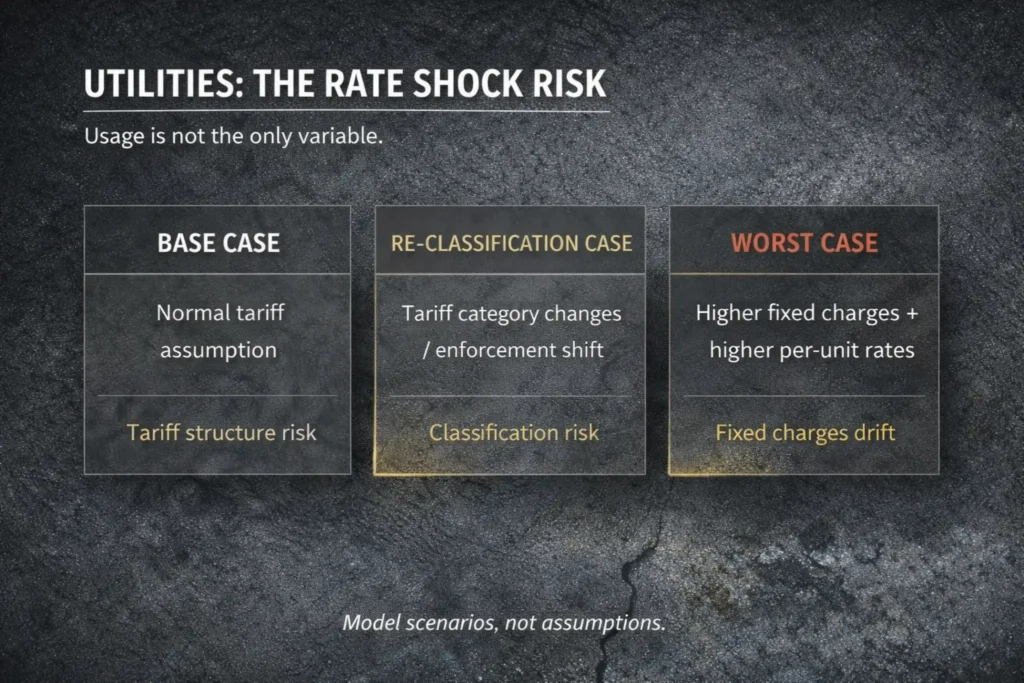
Investor implication: utilities need a rate-risk assumption, not just a usage assumption:
- tariff scenario range (base/downside)
- classification exposure
- contingency for enforcement swings
5) When demand softens, cost inflation becomes a margin trap
Many owners assume demand growth will cover cost growth. In practice, cost inflation often coincides with rate pressure or segment volatility.
This is why hotel operating costs Bali must be stress-tested in scenarios—not modeled as a static percentage—because fixed and semi-fixed costs do not flex down in line with revenue during soft patches.
If you want a service-led pathway to avoid this, Zenith’s broader advisory positioning is described here: Business consultant in Bali: compliance & strategy for success.
PAA-ready answers
Why are hotel operating costs Bali higher than investors expect?
Hotel operating costs Bali are higher because Bali adds structural cost drivers that generic models omit: insurance volatility, climate-driven maintenance intensity, turnover-heavy operations due to short stays, and utilities tariff/classification risks. Those factors raise the baseline cost base and reduce flow-through when revenue softens.
What costs are most underestimated in Bali hotel feasibility studies?
The most underestimated costs are typically insurance, maintenance, and turnover-driven labour intensity. Underfunding these lines creates a predictable sequence: emergency repairs, service variance, rating drops, and capex spikes—followed by margin compression.
How does length of stay affect Bali hotel margins?
Short stays increase the number of arrivals, departures, and room turns per occupied room month. That raises housekeeping labour, laundry volume, amenities usage, linen damage, and FO workload per unit of revenue. Even if ADR holds, cost per occupied room can rise faster than revenue.
HowTo: stress-test hotel operating costs Bali before you invest
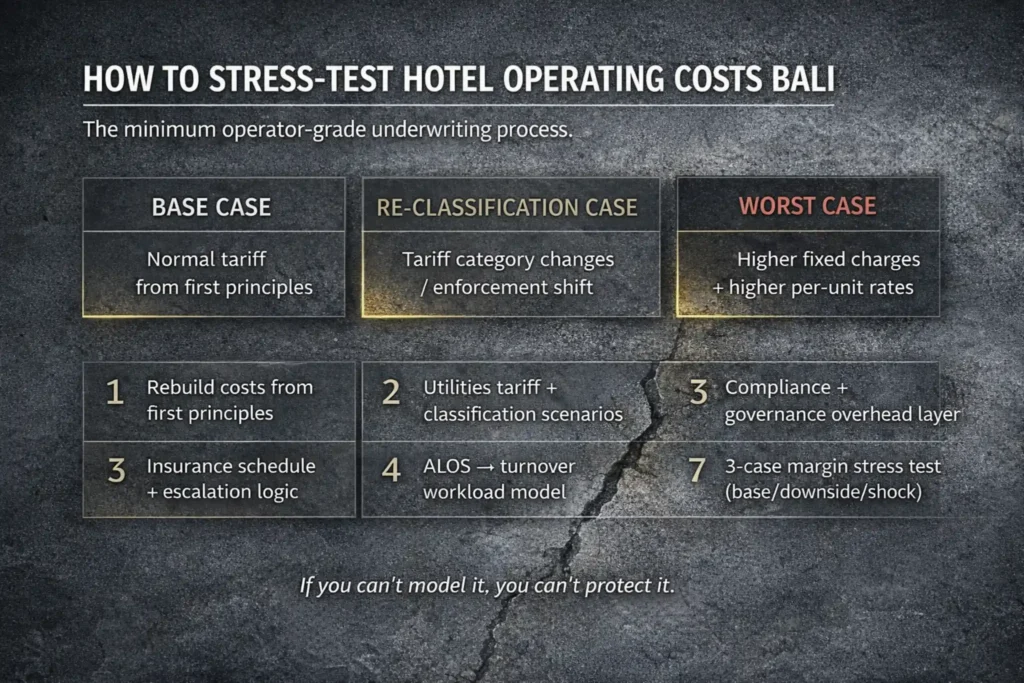
This is the minimum operator-grade process we recommend before final underwriting.
Step 1 — Rebuild the cost model from first principles (not ratios)
- Define service level and concept (boutique leisure, lifestyle, wellness-led, etc.)
- Build staffing by guest flow, not just room count
- Separate fixed, semi-variable, and variable costs (to reveal real breakpoints)
Step 2 — Build an insurance schedule (coverage, exclusions, escalation)
- Map cover + riders relevant to the risk profile
- Model renewal escalation (base and downside)
- Include deductibles and reserve logic
Reference: CBRE operating cost insights.
Step 3 — Convert ALOS reality into turnover workload
Using Bali data as a sanity check (see BPS Bali tourism development), calculate:
- room turns per occupied room month
- housekeeping hours per 100 room nights
- linen cycles and laundry cost per occupied room
- FO transactions per occupied room night
Step 4 — Engineer a Bali climate maintenance plan (with lifecycle reserves)
- Preventive checklists by system: HVAC, pools, roofing, waterproofing, pumps, boards
- Replace-by timelines for corrosion-prone components
- Monthly/quarterly tasks plus annual deep-maintenance calendar
Step 5 — Add utilities tariff + classification scenarios
- Confirm likely PDAM/PLN classification
- Model best/base/worst rate outcomes
- Add contingency for reclassification/enforcement swings
Reference: Bali water tariff/classification discussion.
Step 6 — Add a compliance and governance overhead layer
- HR compliance processes and documentation
- Audit-ready SOPs and reporting cadence
- Licensing workflow clarity via the official portal if needed
External reference: Indonesia OSS licensing portal.
Step 7 — Run a 3-case margin scenario (not one “base case”)
- Base: realistic cost escalation
- Downside: revenue softening + cost escalation
- Shock: demand disruption + higher insurance + tariff shift
This is how you prevent “surprise margin collapse.”
The Zenith angle: cost modeling that matches Bali reality
Zenith does not treat cost lines as static percentages. We build location-specific and concept-specific operating budgets that incorporate:
- climate-appropriate maintenance structures
- Indonesia-specific HR/compliance overhead
- insurance escalation reality and coverage logic
- turnover burden based on stay patterns
- cost breakpoints and scenario protection
That is how hotel operating costs Bali becomes a managed system—not an unpleasant surprise.
FAQ
What is a realistic operating margin for a Bali hotel today?
There is no universal number—margin depends on concept, location, service level, demand mix, and governance. The non-negotiable is this: if your model does not explicitly account for insurance volatility, climate maintenance intensity, turnover workload, and tariff risk, your margin target is fragile.
What is the biggest “hidden cost” in Bali hotel operations?
For many owners, it is the compound effect of insurance escalation and underfunded preventive maintenance. Insurance can reprice quickly, while climate wear converts underfunding into downtime, guest dissatisfaction, and capex spikes.
How do I prevent maintenance from becoming an emergency capex problem?
Treat maintenance as an engineered program: monthly/quarterly preventive tasks, lifecycle reserves for corrosion-prone systems, inspection cadence embedded into SOPs, and accountability reporting. In Bali, maintenance is a margin-protection discipline, not a cost center.
How does Bali’s short-stay profile impact profitability?
Short stays increase arrivals/departures and room turns. That increases housekeeping resets, laundry volume, consumables, and FO workload per unit of revenue. When occupancy softens, these costs do not fall proportionally—so margin compresses faster than investors expect.
What should I ask my feasibility consultant to prove?
Ask for (1) turnover modeling tied to stay patterns, (2) an insurance schedule with escalation and deductibles, (3) a climate maintenance plan with lifecycle reserves, and (4) utilities scenarios including classification risk. If they cannot show that logic, you are underwriting blind.
Summary Takeaways
- Hotel operating costs Bali must be modeled as a system, not a percentage.
- Insurance volatility requires escalation logic and reserves, not a flat line item.
- Short stays create structural turnover friction that increases labour and consumables.
- Preventive maintenance is a margin protection program in tropical environments.
- Utilities can spike due to tariff/classification mechanics—scenario plan it.
- Run 3-case stress tests before final underwriting—then re-forecast quarterly.
Call to action
If you are underwriting a Bali hotel (or already experiencing margin compression), the fastest value is a cost-architecture review: rebuild a turnover model, engineer a climate maintenance plan, and implement insurance + utilities scenario protection.
Author
André Priebs — CEO & Co-Founder, Zenith Hospitality Global
Operator-first hospitality advisor focused on investor-grade feasibility, cost architecture, and performance systems for boutique hotels and wellness-driven assets in Bali and Indonesia.
LinkedIn: https://www.linkedin.com/in/andre-priebs/
Zenith: https://zenith-hospitality.com/